Why 190 million tonnes per annum of export capacity still can’t crack China and India’s sovereign energy systems.
By Joseph Fournier, Ph.D.
North American LNG is booming, but Asian coal isn’t going anywhere. The problem is the other side of the equation. North America’s long-term market for LNG remains Japan, South Korea, Taiwan, and gas-dependent Southeast Asia—not the region’s two biggest coal consumers. China and India burn billions of tonnes of ultra-cheap domestic coal protected by deliberate “coal sovereignty” policies that the 2026 Hormuz crisis only reinforced. Real displacement is happening—but only at the margins. ~ From the analysis by Joseph Fournier, Ph.D. (first published July 30, 2026)
This paper is reprinted here with permission. See Dr. Joseph Fournier’s Substack to read the original version.
North American LNG export capacity is expanding rapidly, approaching 127 MTPA of operational capacity as of mid-2026 and on trajectory to reach approximately 190 million tonnes per annum (MTPA) by the end of the decade [1]. Asia, led by China and India, consumes coal at a scale that dwarfs any single energy substitution in recorded history. China alone consumes an estimated 4.5–4.8 billion tonnes of coal annually, a quantity roughly ten times the total volume of all LNG traded globally in 2024 [2]. India crossed one billion tonnes of annual domestic coal production for the first time in FY 2024–25 [3]. Against this backdrop, the central question examined in this paper is whether North American LNG can structurally penetrate and displace meaningful volumes of Asian domestic coal consumption or whether the economics, infrastructure, and sovereign policy architecture of Asian coal markets represent a ceiling that LNG cannot breach at current and foreseeable price levels.
The analysis is organized around five structural factors:
(1) The scale and trajectory of North American LNG supply;
(2) The scale and production economics of Asian coal;
(3) The coal sovereignty doctrines that anchor domestic coal in both China and India;
(4) The effect of the 2026 Strait of Hormuz blockade on Asian energy market dynamics;
(5) A sector-by-sector examination of where LNG and coal genuinely compete.
The conclusion is that LNG displacement of Asian coal is real but structurally bounded, occurring at the margin in industrial processing, fertilizer feedstocks, and isolated island power markets, while coal’s position in utility-scale power generation and state-owned heavy industry is deeply entrenched by both economics and sovereign policy. North American LNG’s most durable addressable market in Asia remains Japan, South Korea, Taiwan, and gas-dependent Southeast Asian economies, not the two nations that consume the most coal.
SECTION 1: NORTH AMERICAN LNG EXPORT CAPACITY
The United States emerged as the world’s largest LNG exporter beginning in 2023, surpassing Qatar and Australia on a rolling twelve-month basis, a position driven by a decade of permitting, construction, and capital investment concentrated along the Gulf Coast of Texas and Louisiana [4]. The US export infrastructure build-out, anchored by Cheniere Energy’s Sabine Pass and Corpus Christi terminals, was subsequently joined by Dominion Energy’s Cove Point facility (2018), Freeport LNG (2019), Cameron LNG (2019), and Venture Global’s Calcasieu Pass (2022) [5,6]. The commissioning of Venture Global’s Plaquemines LNG terminal in 2025 added a further 20 MTPA of Gulf Coast capacity, while Cheniere’s Train 6 expansion at Sabine Pass contributed an incremental 6 MTPA.
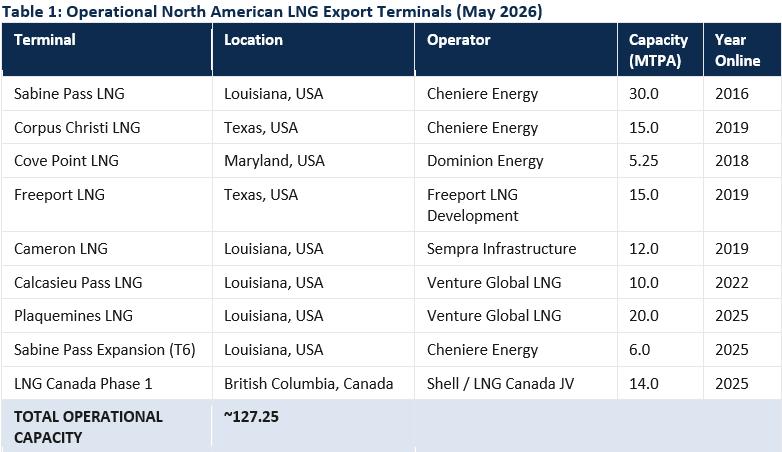
Canada entered the Pacific-facing LNG export market in 2025 with the commissioning of LNG Canada Phase 1 in Kitimat, British Columbia, a Shell-led joint venture delivering 14 MTPA of capacity directly oriented toward northeast and southeast Asian buyers [7]. Combined operational capacity as of mid-2026 approaches 127 MTPA [8,9]. The construction and advanced development pipeline adds substantially to this base, with six major projects at various stages of completion expected to contribute an additional 65 MTPA by 2029.
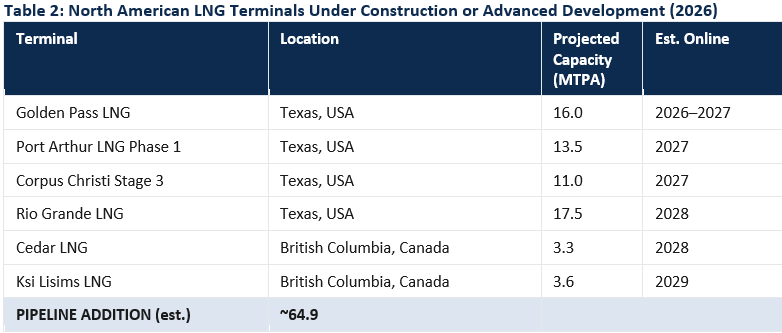
The combined construction pipeline positions North America’s total export capacity at roughly 190 MTPA by decade’s end, surpassing Qatar’s pre-Hormuz blockade LNG output of approximately 110 MTPA and Australia’s approximately 80 MTPA [10,11].
The supply side, in other words, is not the constraint.
North American producers command access to feedstock gas often trading at $1.00–3.50/MMBtu in 2025–2026, providing a cost-competitive liquefaction input relative to global alternatives [12]. The limiting question is not production capacity but market structure: whether Asian coal-consuming economies are economically and structurally open to displacement at scale.
SECTION 2: THE SCALE OF ASIAN COAL — THE MARKET LNG MUST COMPETE AGAINST
The core analytical challenge in assessing LNG-for-coal displacement in Asia is one of relative scale. Asian coal consumption, dominated by China and India, is not comparable in magnitude to any energy market LNG has previously disrupted. It represents a structural baseline against which LNG’s growth, however rapid, must be measured in single-digit percentage terms.
China
China is the world’s largest coal producer and consumer by a decisive and widening margin. According to the U.S. Energy Information Administration’s 2025 Country Analysis Brief, coal accounted for approximately 62% of China’s primary energy consumption in 2023, with domestic production reaching approximately 4.7 billion tonnes, a record at the time of publication [13]. Production has remained elevated through 2024, with output expansion concentrated in Shanxi, Inner Mongolia, and Shaanxi provinces [14].
Raw coal consumption grew 1.7% year-on-year in 2024 according to China Energy Transition Programme data [15]. For reference, total global LNG trade in 2024 was approximately 410–420 million tonnes in volume equivalent across all origins and destinations [16]. China’s coal consumption alone was roughly ten times that figure.
China’s LNG imports reached approximately 78 million tonnes in 2024, a 9% increase year-on-year, according to Kpler trade data cited by IEEFA [17.18]. Supply was sourced primarily from Australia (approximately 34%), Qatar (approximately 24%), Malaysia (approximately 10%), Russia (approximately 9%), and the United States (approximately 6%).
US LNG’s 6% share, approximately 4.7 MTPA, is volumetrically dwarfed by China’s domestic coal output, which exceeds US LNG imports by a factor exceeding 1,000 on a raw tonne basis.
The cost differential explains the asymmetry: large Chinese coal producers operate at full-cycle costs of approximately $65 per tonne in 2024–2025, having moderated from the $75/tonne range seen in 2021–2023 [19]. At a thermal conversion rate of approximately 25 MMBtu per tonne of coal equivalent, this translates to a mine-mouth energy cost of approximately $2.6/MMBtu for large Chinese operators, which is highly competitive with long-term delivered LNG at $10–14/MMBtu, and even more so than JKM spot prices of $17+ /MMBtu as of May 2026 [20].
These numbers must be framed in light of the fact that China’s coal mining capacity is slated to expand by an additional 25% by 2030.
India
India crossed a historic production milestone in FY 2024–25, extracting over one billion tonnes of coal for the first time, specifically 1,047 million tonnes, representing a 5% year-on-year increase, according to India’s Press Information Bureau and Ministry of Coal [21,22].
India is now the world’s second-largest coal producer by volume.
Coal accounts for 55–60% of India’s total primary energy mix and powers over 74% of total electricity generation; structural ratios that reflect both the scale of India’s power generation fleet and the economics of domestic extraction relative to imported alternatives [23,24].
Notably, India’s coal imports declined 8.4% in the April–December 2024 period, generating an estimated $5.43 billion in foreign exchange savings; an outcome explicitly framed by the Ministry of Coal as a measure of energy security policy success, not a market outcome [25].
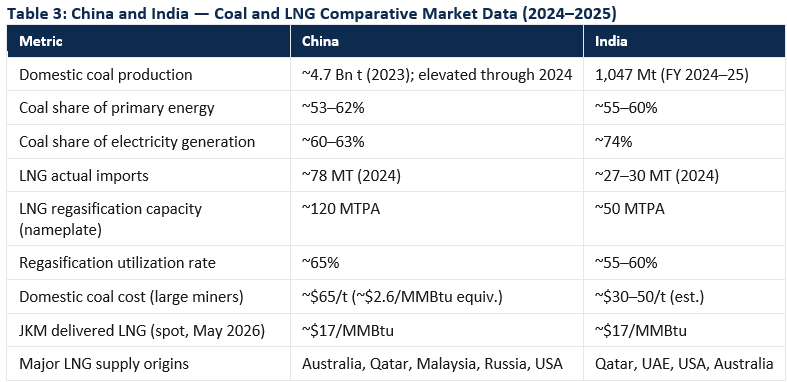
The competitive reality established by this data is clear: LNG must displace a fuel that China produces domestically at approximately $65/tonne for large-scale operators, with smaller marginal producers at $100–130/tonne, as identified by Wood Mackenzie’s supply cost curves [26].
India operates its domestic coal base at substantially lower extraction costs, given shallower seam geology in many producing states, with Coal India Limited reporting average production costs well below those of Chinese peers [27]. At JKM spot pricing of $17/MMBtu as of May 2026, LNG carries a large premium over Chinese domestic coal on an energy-equivalent delivered basis, a premium that utility-scale coal consumers are structurally unable to absorb within their operating economics.
SECTION 3: COAL SOVEREIGNTY DOCTRINES — THE STRUCTURAL ANCHOR
Beyond market economics, the displacement question must be assessed through the lens of what this analysis terms coal sovereignty doctrine, which is the explicit, codified state decision to maintain domestic coal production at strategically significant levels regardless of short-term import economics. This is distinct from a conventional market subsidy or regulatory preference. It represents a deliberate strategic posture in which governments treat domestic coal capacity as a hedge against import dependency, external price volatility, and geopolitical supply disruption.
China
China’s coal sovereignty is institutionally embedded. The 14th Five-Year Plan for Energy (2021–2025), promulgated by the National Development and Reform Commission (NDRC), explicitly mandates the maintenance and expansion of domestic coal production capacity as a primary instrument of energy security [28].
This directive is not rhetorical: it has been operationalized through production quota expansions, emergency mine authorization, and administrative pressure on provincial governments to maintain output levels during periods of external supply volatility.
Chinese policymakers explicitly frame coal as the sea-calming divine needle or ballast stone (定海神针) of national energy security [29]. The phrase is drawn from the classic 16th-century novel Journey to the West (西游记), in which the 定海神针 is a pillar of immense magical mass used by the Dragon King to stabilize the seas; Sun Wukong later wields it as an all-powerful weapon.
In invoking this image, Chinese policymakers cast coal not merely as a fuel but as the singular stabilizing force upon which the entire energy order rests and as an asset whose removal would invite chaos. The rhetorical parallel is King Arthur’s Excalibur: just as Excalibur was inseparable from the legitimacy and power of the sovereign, coal in the Chinese framing is inseparable from the legitimacy of the state’s energy security guarantee.
The response to global LNG and coal price spikes in 2021–2022 is instructive.
When international LNG prices surged following supply tightening in Europe, China’s administrative response was not to accelerate LNG import contracting, it was to authorize emergency coal production increases, reopen idled mines, and expand output quotas across the Shanxi, Inner Mongolia, and Shaanxi coal basins [30]. The result was record domestic coal output in 2022 and 2023, sustained into 2024.
The state’s revealed preference, when faced with a choice between import price exposure and domestic production expansion, has been consistent and unambiguous.
The pipeline gas dimension reinforces this picture. Russia’s Power of Siberia 1 pipeline currently supplies approximately 22 billion cubic metres per year (bcm/yr) to China’s northeast, providing a pipeline gas alternative to LNG that is structurally insulated from JKM pricing. The planned Power of Siberia 2 pipeline, projected at 50 bcm/yr by the early 2030s pending final commercial agreement, would add a further tranche of non-LNG gas supply, acting to reduce the addressable ceiling for LNG market share even in scenarios where coal displacement occurs at the margin [31].
India
India’s coal sovereignty doctrine is less formally articulated in a single planning document but is equally structural in practice. The Indian government’s ownership of Coal India Limited (CIL), which produces approximately 80% of India’s domestic coal supply, means that coal output is a matter of state industrial and employment policy, not merely market economics [32]. CIL’s production decisions are effectively instruments of sovereign energy strategy, buffered from commodity price signals that would otherwise induce supply rationalization.
India’s Ministry of Coal has publicly established a target of 1.5 billion tonnes of annual production by 2030, supported by continued capital investment in new mine development, rail evacuation infrastructure, and domestic processing capacity. The 8.4% decline in coal imports recorded in the April–December 2024 period, cited explicitly as a $5.43 billion foreign exchange saving and an energy security milestone, is the operational expression of this doctrine.
Declining import dependency is the stated objective; market signals to the contrary are not treated as authoritative inputs into procurement decision-making at state-owned utilities.
The practical consequence for LNG market penetration is material: coal sovereignty doctrines establish an effective price floor below which domestic coal supply is maintained by state action independent of market economics. LNG cannot reliably displace coal in sectors where state-owned utilities and state-directed heavy industry are the primary consumers, because purchasing decisions in those sectors do not optimize against spot commodity price in the manner that private industrial buyers do.
The addressable LNG market in China and India is therefore structurally bounded to the private industrial and commercial sectors and even there, it faces the cost arithmetic documented in Section 2.
SECTION 4: THE 2026 STRAIT OF HORMUZ BLOCKADE — STRESS TEST AND PARADOX
The Strait of Hormuz, through which approximately 20–25% of global LNG trade transited prior to the current crisis, has been effectively closed since early 2026 under an ongoing naval blockade. As of June 2026, tanker traffic through the Strait is down more than 95% against pre-crisis averages, with an estimated 800-plus vessels stranded in the Persian Gulf awaiting clearance. Qatar, whose pre-crisis LNG exports totaled approximately 77 MTPA, representing roughly 18–20% of total global LNG supply, has had its export fleet largely immobilized at the Ras Laffan terminal complex. The JKM spot price assessment as of May 18, 2026, stands at approximately $17.15/MMBtu, reflecting the acute tightening of non-Hormuz supply available to spot-market buyers in Asia [33].
Effect on Non-China Asian Buyers
For Japan, South Korea, Taiwan, and several Southeast Asian importing economies, the Hormuz crisis has precipitated an acute supply emergency. These nations hold minimal domestic energy reserves of strategic consequence and have constructed their energy systems around LNG import dependency by deliberate policy design [34].
The blockade has accelerated long-term Sale and Purchase Agreement (SPA) negotiations with US Gulf Coast and Canadian West Coast suppliers, including reported advanced discussions involving JERA (Japan’s largest power generator), KOGAS (Korea Gas Corporation), and several European counterparties seeking supply diversification [35].
The crisis has validated, in commercial terms, the argument that geographically diversified LNG supply, specifically, Atlantic Basin and Pacific Coast sources not exposed to the Hormuz chokepoint, constitutes a structural supply-security necessity. LNG Canada Phase 1’s loading at Kitimat, British Columbia, and US Gulf Coast terminals routing via the Panama Canal are both categorically outside Hormuz exposure.
North American LNG’s geographic position is a concrete and quantifiable commercial advantage in this environment, and it is translating into contract formation that will establish durable long-term volume commitments [36].
Effect on China — The Paradox
The dynamic in China inverts sharply relative to the allied importer group. The Hormuz blockade has functioned as a domestic communications asset reinforcing Beijing’s coal sovereignty position. Chinese state media coverage of European and Japanese LNG price spikes, now exceeding $17/MMBtu on the spot market, has been framed explicitly as empirical evidence that LNG import dependency represents a strategic vulnerability.
This is precisely the argument that underpins the NDRC’s domestic coal expansion mandate.
Beijing’s operational response to the supply disruption has not been to accelerate LNG import contracting from alternative non-Hormuz sources. It has been to increase utilization rates at existing coal-fired generating capacity and authorize additional domestic coal production.
Power of Siberia 1 pipeline offtake has also been maximized. This paradox, whereby the crisis that created urgent LNG demand among allied importing nations simultaneously hardened China’s institutional resistance to LNG import dependency, is among the most structurally important findings of this analysis.
The crisis has not opened the door to coal displacement in China; it has reinforced the rationale for keeping that door closed.
Effect on India
India’s response to the Hormuz disruption has been more pragmatic and commercially opportunistic, consistent with its historical pattern of price-sensitive spot LNG purchasing behaviour. As a price-sensitive but increasingly large industrial LNG importer, principally for fertilizer feedstocks and petrochemical inputs, India has selectively increased spot LNG purchases from non-Hormuz origins where prices remain within its economic ceiling, while simultaneously accelerating domestic coal production expansion.
The Hormuz crisis has not fundamentally altered India’s energy mix trajectory. Coal production expansion continues at record pace, LNG remains a supplementary industrial input rather than a system-level energy source, and the fertilizer sector remains the primary legitimate demand engine for LNG volumes in the Indian market.
Net Assessment for North American LNG
The Hormuz blockade has created a near-term demand surge for non-Hormuz LNG supply, and North American terminals are among the primary beneficiaries of this structural reorientation. Long-term contract formation in Japan, South Korea, and parts of Europe has been materially accelerated.
However, the crisis has had either a neutral or counterproductive effect on LNG market penetration into the two largest Asian coal-consuming economies.
China’s response has been coal consolidation; India’s response has been coal expansion combined with selective, economics-driven LNG opportunism at volumes that do not alter the structural picture. The 2026 Hormuz shock has clarified, rather than altered, the structural limits of LNG’s role in Asian coal displacement.
SECTION 5: INDUSTRIAL-SECTOR COMPETITION — WHERE LNG AND COAL ACTUALLY COMPETE
Stepping back from the utility-scale power sector, where coal’s economic and sovereign entrenchment is strongest, reveals a more differentiated picture at the industrial and commercial level. Several specific sectors present genuine LNG-versus-coal competition in which substitution is already occurring, and in which the economics are materially closer to parity than in the power generation context.
Steel
Coking coal (metallurgical coal) used in blast furnace ironmaking is not substitutable by LNG or any gaseous fuel through conventional processing routes. However, direct-reduced iron (DRI) production using natural gas as a reductant represents a genuinely competing process route.
Gas-based DRI facilities have been commissioned in India and several Southeast Asian markets where natural gas pipeline infrastructure exists [37]. LNG-fed DRI is technically feasible, but at JKM pricing of $17/MMBtu, gas-based DRI steel production in India is uncompetitive against blast furnace steel produced using domestic coal at $30–50/tonne equivalent.
This competitive gap narrows as LNG spot prices fall below approximately $10–11/MMBtu, a level seen in 2020 and in certain shoulder periods of 2023, but not representative of the current post-Hormuz pricing environment.
Cement
Coal is the dominant kiln fuel in Asian cement production. LNG substitution in cement kilns has occurred in niche industrial clusters along China’s coastal provinces, where gas distribution network infrastructure reaches established industrial parks and where industrial tariff structures have historically been more favourable to gas.
However, the cost differential at current prices remains decisive.
At approximately $65/tonne for domestic Chinese coal versus $17/MMBtu for JKM-priced LNG, coal retains a commanding cost advantage for rotary kiln applications. Structural displacement in cement is not occurring at scale under current market conditions and is not projected to occur under most pricing scenarios presented in analyst forward curve analysis through 2030 [38].
Chemicals and Fertilizers
The fertilizer and petrochemical sectors represent the most commercially viable arena of genuine LNG-versus-coal competition in Asia, and the sector where North American LNG’s displacement case is strongest. Natural gas is the preferred feedstock for ammonia and urea production via steam methane reforming (SMR), and SMR-based plants are operationally distinct from coal gasification-based fertilizer routes in ways that make switching costs real but not prohibitive over medium-term planning horizons [39].
India’s fertilizer sector, subject to government procurement pricing and feedstock subsidy arrangements, represents the largest legitimate industrial LNG demand engine that is both price-sensitive and partially insulated from direct coal competition by process chemistry requirements.
Indian fertilizer plants that cannot access piped natural gas have adopted LNG as a regasified feedstock input, a practice growing across the sector. The aggregate demand scale remains manageable, approximately 5–8 MTPA India-wide in current market conditions, but this represents the clearest existing displacement vector with demonstrated commercial momentum.
LNG Bunkering
International maritime shipping represents a structurally growing LNG demand sector that operates independently of the coal competition dynamic. IMO vessel efficiency and sulphur content regulations are driving LNG-powered newbuild orders across the container and bulk carrier segments, with significant order books at South Korean and Chinese shipyards [40].
LNG bunker demand in Asian ports is projected at 30–35 MTPA by 2030 in consensus analyst estimates [41].
This is not a coal displacement market, it is primarily an HFO (heavy fuel oil) displacement market, but it constitutes a structurally expanding demand vector for North American LNG volumes at Asian bunkering hubs and does not require coal-competitive pricing to be economically viable.
Small-Scale and Island Power Markets
In electricity-isolated markets, Philippine island grids, Indonesian outer islands, Vietnamese industrial zones not connected to national transmission networks, LNG delivered via FSRU (floating storage and regasification units) and small-scale import terminals competes directly against diesel generation and, in some cases, against imported coal for dedicated island power plants [42].
These markets are smaller in aggregate volume (approximately 2–5 MTPA at present across the Southeast Asian archipelago) but represent the highest-probability coal displacement vector identified in this analysis, because they lack entrenched domestic coal supply infrastructure, face high delivered coal costs (due to logistics complexity), and have utility-scale buyers who respond to commercial economics rather than sovereign procurement mandates.
FSRU-based LNG supply to Philippine and Indonesian island grids has demonstrated commercially viable displacement economics at LNG delivered costs below approximately $14/MMBtu, achievable for US Gulf Coast LNG under long-term contracts in normal (non-Hormuz disruption) pricing environments [43].
SECTION 6: ASSESSMENT — THE DISPLACEMENT VERDICT
Synthesizing the five analytical dimensions above produces a structured, evidence-grounded verdict on the central question: Can North American LNG realistically displace Asian domestic coal production and consumption?
Where Displacement Is Occurring
LNG is displacing some coal volumes in Chinese coastal industrial clusters (cement, glass, and chemical production in gas-networked zones), Indian fertilizer feedstocks (SMR-route ammonia and urea production), Southeast Asian island electricity markets (FSRU-delivered power generation displacing coal or diesel), and in the growing LNG marine bunkering sector serving Asian ports.
These represent real, commercially grounded, and incrementally growing substitution volumes. Collectively, they are estimated on the order of 5–20 MTPA in current Asian markets, with growth potential to perhaps 30–40 MTPA across the regional industrial sector by 2030 under pricing conditions more favourable than the current Hormuz-elevated environment.
Where Displacement Is Structurally Blocked
In utility-scale coal power generation, which accounts for approximately 60–63% of electricity in China and approximately 74% in India, LNG cannot displace coal at current and projected delivered prices under any pricing scenario presented by major analyst houses through 2030 [44].
Chinese domestic coal costs of approximately $65/tonne ($12/MMBtu equivalent) for large producers, combined with the state-directed procurement structures governing utility coal supply chains, mean that economic substitution does not occur even when LNG long-term contract prices decline to the $10–12/MMBtu delivered range.
State-owned utilities are not making fuel switching decisions based on marginal commodity economics; they are executing procurement mandates within sovereign energy policy frameworks. India’s one-billion-tonne domestic production base, expanding state coal infrastructure, declining import dependency trajectory, and Coal India Limited’s institutional scale tell the same structural story through a different institutional mechanism.
The Hormuz Variable
The 2026 Strait of Hormuz blockade has created a short-term demand spike for non-Hormuz LNG supply and accelerated long-term contract formation in Japan, South Korea, Taiwan, and parts of Europe, all of which are translating into durable volume commitments for North American LNG producers [45]. For these markets, North American LNG is performing a genuine supply-security function with quantifiable commercial value.
However, China’s and India’s responses to the crisis have been coal expansion and domestic production consolidation respectively. The Hormuz shock has not altered the coal sovereignty calculus in either nation; in China’s case, it has reinforced the institutional and communications rationale for continuing that posture.
Bottom Line
North American LNG is expanding into a global market that wants more of it, but the markets that want it most are not the markets that consume coal most. Japan, South Korea, Taiwan, and gas-constrained Southeast Asian economies constitute the real addressable long-term market for North American LNG volumes, and the Hormuz crisis has accelerated and deepened that commercial relationship.
China and India, which together account for roughly 70% of Asian coal consumption, present structural barriers compounded of sovereign policy doctrine, domestic production economics, and state-directed procurement that LNG cost economics alone cannot overcome at current and foreseeable price levels. Displacement at the margin is real and commercially growing. Displacement at scale, in utility power generation and state-owned heavy industry, is not supported by the evidence base examined in this analysis.
- U.S. Energy Information Administration. United States LNG Export Capacity: 2016–2026 Cumulative Build-Out. EIA, Washington DC, March 2026.
- U.S. Energy Information Administration. China Country Analysis Brief. EIA, Washington DC, May 2025.
- Press Information Bureau, Government of India. “India’s Coal Production Surpasses One Billion Tonnes: A Historic Milestone.” Ministry of Coal, New Delhi, April 2025. pib.gov.in.
- U.S. Energy Information Administration. United States LNG Export Capacity: 2016–2026 Cumulative Build-Out. EIA, Washington DC, March 2026.
- Cheniere Energy, Inc. Annual Report 2025: LNG Export Operations, Sabine Pass and Corpus Christi Terminals. Cheniere Energy, Houston TX, March 2026.
- Venture Global LNG. Project Status Reports: Calcasieu Pass and Plaquemines LNG — Construction and Commissioning Update. Venture Global LNG, Arlington VA, Q4 2025.
- LNG Canada. Phase 1 Commissioning Update: First LNG Production and Export from Kitimat, British Columbia. LNG Canada Joint Venture, Kitimat BC, October 2025.
- Federal Energy Regulatory Commission (FERC). LNG Export Authorization Database and Terminal Status Register. FERC, Washington DC, updated April 2026.
- U.S. Department of Energy, Office of Fossil Energy and Carbon Management. LNG Export Statistics: Monthly and Annual Authorizations. DOE, Washington DC, 2026.
- International Group of LNG Importers (GIIGNL). GIIGNL Annual Report 2025: Global LNG Trade, Capacity, and Market Outlook. GIIGNL, Neuilly-sur-Seine, April 2025.
- Wood Mackenzie. North American LNG Supply Outlook 2026: Cost Curves, Contract Formation, and Market Share Scenarios. Wood Mackenzie Ltd, Edinburgh, February 2026.
- International Energy Agency. Coal 2025: Analysis and Forecast to 2027 — Prices, Costs, and Competitiveness. IEA, Paris, December 2025.
- U.S. Energy Information Administration. China Country Analysis Brief. EIA, Washington DC, May 2025.
- Thunder Said Energy. “China Coal Production Costs: Cost Curve and Competitive Positioning.” Thunder Said Energy Research Note, updated April 2026.
- China Energy Transition (CET) Programme. Summary of China’s Energy and Power Sector Statistics 2024.
- International Group of LNG Importers (GIIGNL). GIIGNL Annual Report 2025: Global LNG Trade, Capacity, and Market Outlook. GIIGNL, Neuilly-sur-Seine, April 2025.
- IEEFA / Reynolds, S. Understanding the Competitive Landscape for China’s LNG Market. Institute for Energy Economics and Financial Analysis, Lakewood OH, April 2025.
- Kpler. LNG Trade Data: 2024 Annual Review — Global Flows, Origin Breakdown, and Asian Destination Analysis. Kpler Commodity Intelligence, Brussels, January 2025.
- Thunder Said Energy. “China Coal Production Costs: Cost Curve and Competitive Positioning.” Thunder Said Energy Research Note, updated April 2026.
- S&P Global Commodity Insights / Platts. JKM LNG Price Assessment Methodology and Specifications Guide. S&P Global, New York, revised January 2025.
- Press Information Bureau, Government of India. “India’s Coal Production Surpasses One Billion Tonnes: A Historic Milestone.” Ministry of Coal, New Delhi, April 2025.
- India Ministry of Coal. Annual Report FY 2024–25: Coal Production, Import Substitution, and Coal India Limited Operational Performance. Ministry of Coal, Government of India, New Delhi, April 2025.
- China Energy Transition (CET) Programme. Summary of China’s Energy and Power Sector Statistics 2024. China-EU Energy Cooperation Platform, Brussels / Beijing, March 2025.
- BP plc. Statistical Review of World Energy 2024: 73rd Edition. bp.com/statisticalreview, London, June 2024.
- India Ministry of Coal. Annual Report FY 2024–25: Coal Production, Import Substitution, and Coal India Limited Operational Performance. Ministry of Coal, Government of India, New Delhi, April 2025.
- Wood Mackenzie. North American LNG Supply Outlook 2026: Cost Curves, Contract Formation, and Market Share Scenarios. Wood Mackenzie Ltd, Edinburgh, February 2026.
- India Ministry of Coal. Annual Report FY 2024–25: Coal Production, Import Substitution, and Coal India Limited Operational Performance. Ministry of Coal, Government of India, New Delhi, April 2025.
- National Development and Reform Commission (NDRC), People’s Republic of China. 14th Five-Year Plan for Energy (2021–2025): Energy Security, Domestic Production Mandates, and Coal Capacity Guidance. NDRC, Beijing, March 2022.
- Government of the People’s Republic of China. Outline of the 14th Five Year Plan for National Economic and Social Development and Long Range Objectives for 2035. Beijing: National People’s Congress, March 2021. Energy security and coal policy sections (Chapters 11 and 12).
- Thunder Said Energy. “China Coal Production Costs: Cost Curve and Competitive Positioning.” Thunder Said Energy Research Note, updated April 2026.
- Rystad Energy. Asian LNG Demand Scenarios 2025–2035: Sector Decomposition, Coal Competition, and Price Sensitivity Analysis. Rystad Energy, Oslo, November 2025.
- India Ministry of Coal. Annual Report FY 2024–25: Coal Production, Import Substitution, and Coal India Limited Operational Performance. Ministry of Coal, Government of India, New Delhi, April 2025.
- S&P Global Commodity Insights / Platts. JKM LNG Price Assessment Methodology and Specifications Guide. S&P Global, New York, revised January 2025.
- Japan Organization for Metals and Energy Security (JOGMEC). LNG Market Outlook 2025: Supply Security, Contract Diversification, and Northeast Asian Procurement Strategies. JOGMEC, Tokyo, March 2025.
- International Group of LNG Importers (GIIGNL). GIIGNL Annual Report 2025: Global LNG Trade, Capacity, and Market Outlook. GIIGNL, Neuilly-sur-Seine, April 2025.
- LNG Canada. Phase 1 Commissioning Update: First LNG Production and Export from Kitimat, British Columbia. LNG Canada Joint Venture, Kitimat BC, October 2025.
- Rystad Energy. Asian LNG Demand Scenarios 2025–2035: Sector Decomposition, Coal Competition, and Price Sensitivity Analysis. Rystad Energy, Oslo, November 2025.
- Wood Mackenzie. North American LNG Supply Outlook 2026: Cost Curves, Contract Formation, and Market Share Scenarios. Wood Mackenzie Ltd, Edinburgh, February 2026.
- International Energy Agency. Coal 2025: Analysis and Forecast to 2027 — Prices, Costs, and Competitiveness. IEA, Paris, December 2025.
- International Maritime Organization. 2023 IMO Strategy on Reduction of GHG Emissions from Ships: Annex 1 — Revised Strategy Framework. IMO, London, July 2023.
- Rystad Energy. Asian LNG Demand Scenarios 2025–2035: Sector Decomposition, Coal Competition, and Price Sensitivity Analysis. Rystad Energy, Oslo, November 2025.
- Rystad Energy. Asian LNG Demand Scenarios 2025–2035: Sector Decomposition, Coal Competition, and Price Sensitivity Analysis. Rystad Energy, Oslo, November 2025.
- S&P Global Commodity Insights / Platts. JKM LNG Price Assessment Methodology and Specifications Guide. S&P Global, New York, revised January 2025.
- Wood Mackenzie. North American LNG Supply Outlook 2026: Cost Curves, Contract Formation, and Market Share Scenarios. Wood Mackenzie Ltd, Edinburgh, February 2026.
- International Group of LNG Importers (GIIGNL). GIIGNL Annual Report 2025: Global LNG Trade, Capacity, and Market Outlook. GIIGNL, Neuilly-sur-Seine, April 2025.
Categories: China Energy Industry, Geopolitics
 Patricia Adams
 Dai Qing
 Fan Xiao
 Lawrence Solomon
 Mu Lan
 Probe International
 Lisa Peryman
 Patricia Adams and Lawrence Solomon
 Other News Sources